Out of the Sea
This is a collaborative, client-oriented project that I worked on with Javier Martinez and Alexander Nguyen, at the request of an organization involved in contracting work for FEMA (Federal Emergency Management Agency). This work was not compensated, and is not proprietary.
Our goal in this project was to make initial steps toward designing and implementing a web-tool or an app for tracking developments during a disastrous event, in close to real time. While traditional methods for alerting on such events rely on official information derived from official sources (e.g. USGS), we were tasked here with attempting to utilize social media activity to identify these events and alert when an event first occurs. The question we look at primarily here is, given a sea of text content from social media platforms, how do you identify what is relevant information for emergency response personnel? And what sort of implementation would be valuable?
CONTENTS:
- Importing Libraries
- Data Collection
- Pulling Tweets with Twython
- Filtering for Disaster Tweets: Figure Eight Model
- Filtering for Disaster Tweets: Crisis Words
- Apply Filters to Generate List of Disaster Tweets
- Identifying Critical Tweets Among Disaster Tweets
- Testing 2-Phase Model (1. Disaster Filter, 2. Predict Critical) on New Data
- Results on Test Data
- Create Combined Landfall Dataset with Class Labeling
- Geomapping Landfall Data in Tableau
- Live Streaming Disaster Tweets via Twython
- Conclusions:
Importing Libraries
import pandas as pd
import numpy as np
import matplotlib.pyplot as plt

from twython import Twython
from tqdm import *
from time import sleep

from sklearn.feature_extraction.text import CountVectorizer, TfidfVectorizer, HashingVectorizer
from sklearn.model_selection import train_test_split, GridSearchCV
from sklearn.pipeline import Pipeline

from sklearn.linear_model import LogisticRegression
from sklearn import svm
from sklearn.naive_bayes import MultinomialNB
from xgboost import XGBClassifier
from sklearn.ensemble import RandomForestClassifier, GradientBoostingClassifier, VotingClassifier
from sklearn.metrics import confusion_matrix, classification_report, accuracy_score

import re
from wordcloud import WordCloud
import pickle
pd.set_option('display.max_rows',1000)
Data Collection
Our initial plan was to try and real-time map incoming tweets using Twitter, Facebook, Instagram, Snapchat, etc. We quickly found that the APIs for these social media platforms have become much more restrictive than they used to be. The limits on how many tweets we could get at one time were such that it wasn't feasible to build out a dataset that would support training a model. We also could not get geolocation. We needed a different approach.
We found a useful dataset on the website CrisisLex, which collects datasets specific to NLP applications in disaster scenarios. This dataset contained tweet IDs for all geotagged tweets (6 million +) from affected areas of the Eastern Seaboard during the 11 day period surrounding Hurricane Sandy's landfall (10/22/2012-11/2/2012). The tweets include all content, not just disaster-related tweets.
You can use specific tweet IDs to pull dictionaries corresponding to the specific tweets. Having specific tweet IDs also allows you to collect up to 900 tweets every fifteen minutes, which is much larger than the normal limit. The fact that geotags with precise coordinates of sending location and timestamps to the second are included in the data is also very relevant, as it allows live-mapping, and accurately simulates the kind of information we would expect FEMA to have access to in this type of real-world application scenario.
Hurricanes, of all disasters, are probably the best-equipped to represent a generalizable lexicon, as hurricanes often involve a combination of flooding, fires, building damage/collapse, sufficient wind to down trees, explosions, injuries, deaths, trapped/stranded individuals, etc. Obviously, the training data could be expanded to include a variety of disaster types in the future.
Further Information on the CrisisLex Sandy Tweet ID Dataset:
- CrisisLex: SandyHurricaneGeoT1 Geo-Located tweets from the 2012 Sandy Hurricane
- Contents: tweet ids for 6,556,328 tweets, representing all tweets from October 22nd, 2012 —the day Sandy formed— until November 2nd, 2012 — the day that it dissipated.
- Sampling method: tweets were geotagged and located in Washington DC or one of 13 US states affected by Sandy: Connecticut, Delaware, Massachusetts, Maryland, New Jersey, New York, North Carolina, Ohio, Pennsylvania, Rhode Island, South Carolina, Virginia,West Virginia. This filter was based on a set of bounding boxes that covered the desired area, which also covered small parts of adjacent states.
- Labels: no labels. The corpus contains tweets both relevant and irrelevant to Hurricane Sandy (no content based filter was applied).
- Data format: comma-separated values (.csv) files containing the tweet ID, the time stamp of the tweet, a field indicating whether the tweet contains word "sandy".
Cleaning Sandy ID List
#Imports the list of 6 Million IDs
data = pd.read_csv('../../release.txt',sep= ' ', header = None)
data.head()
data.shape
#Split data into respective columns, create datetime column, drop unnecessary columns

df = data[0].map(lambda x: x.split('\t'))
df = pd.DataFrame(df)
df['timestamp'] = df[0].map(lambda x: x[1])
df['tweet_id'] = df[0].map(lambda x: x[0])
df['bool'] = df[0].map(lambda x: x[2])
df = df.drop(columns=0)
df['tweet_id'] = df['tweet_id'].map(lambda x: x.split(':')[2])
df['datetime'] = pd.to_datetime(df['timestamp'])
df = df.drop(columns=['timestamp','bool'])
df.head()
Building ID List for Sandy Training Set
We wanted to simulate the sort of access to Twitter that FEMA would have during a crisis situation, i.e.; all geotagged and timestamped tweets within some period of time. Moreover, we anticipated that our classes in our final model would be unbalanced, because actually critical disaster tweets would be quite rare. We wanted to sample from the period that would have as many of these as possible, in order to have more of them to train on and rely less on bootstrapping.
Accordingly, we chose to sample from the window surrounding the landfall of Hurricane Sandy in New Jersey and New York (~8PM ET, October 29th, 2012. We calculated that we could reasonably aim to pull about 180000 tweets for the training set, timewise. We chose to pull all tweets from the list for the 3 hour period spanning from 1 hour prior to landfall to 2 hours afterward, so approximately 7PM-10PM that night.
dftime = df.sort_values('datetime')
dftime = dftime.reset_index(drop=True)

#Picked the time index corresponding approximately to landfall of the hurricane
dftime[dftime['datetime']=='2012-10-30 00:00:01'].head()

#creates our major id list, from approximate time of landfall in NJ to about 3 hours later
#(i.e., 180000 tweets down the timestamp-sorted ID list), all geotagged tweets in that time
#continuous timespan also allows us to show complete minute to minute mapping visualization
sandy_id_time = dftime.loc[4428365:4608434,:]
sandy_id_time.to_csv('./csvs/sandy_train_ids.csv',index=False)
Pulling Tweets with Twython
Each of us created Twitter Development accounts and submitted applications for the project. We each created two sets of Twitter API app keys so that we could pull tweets in tandem to allow for higher volume data collection.
CONSUMER_KEY = 'INSERT KEY HERE'
CONSUMER_SECRET = 'INSERT KEY HERE'

OAUTH_TOKEN = 'INSERT KEY HERE'
OAUTH_SECRET = 'INSERT KEY HERE'
twitter = Twython(CONSUMER_KEY, CONSUMER_SECRET, OAUTH_TOKEN, OAUTH_SECRET)
Pulling a Single Tweet
sandy_train_ids['tweet_id'][2]
twitter.show_status(id='260244088161439744')
Building a Pull Loop
We were aware the cap was 900 tweets in 15 minutes. While we could set up a Twython call to run through some number of indices in our id list, once it hit the 900 limit, it would continue to mow through indices without actually getting anything. This 900 count includes the significant percentage (~25%) of these old Sandy tweets that have since been deleted and yield no information, they are still counted as tweet calls. So basically we would move 900 indices through the tweet id list per pull, regardless.
We needed a way to automate looping through this pull process at least a few times so as not to end up with some ridiculous number of csvs, and so we could leave things running. In order to achieve this, we needed the loop to know where to pick up on each new pull.
#Goes through a block of 900 indices from the tweet list, from some start index.
#Pulls tweet dictionary if tweet exists and adds to lst, otherwise continues to next index.
#Returns a list with the start index for the next pull, and the lst containing all the tweet dicts.
#Tqdm allows us to track the progress visually with each pull, as seen below.

def tweet_pull(start_index):
    tweet = None
    lst = []
    for i in tqdm(range(start_index,start_index+900)):
        try:
            dct = twitter.show_status(id=str(sandy_train_ids['tweet_id'][i]))
            lst.append(dct)
        except:
            tweet = None
        sandy_train_ids.set_value(i, 'tweet_texts', tweet)
    return [start_index+900,lst]
#While loop for tweet pulling
#Simply set count = [index you want to start at], and set while count < [index you want to end at] (multiple of 900, ideally)
#The while loop will run through all the indices in pulls of 900, shifting the start index up 900 each time,
#and sleeping 15 minutes after each pull to make sure we are never drawing on empty.
#The pulls are added to a single list of dictionaries that can be converted into a df.

count = 0
tweets = []
while count < 3600:
    pull = tweet_pull(count)
    tweets.extend(pull[1])
    count = pull[0]
    sleep(900) #15 minute limit
sandy = pd.DataFrame(tweets)
sandy.shape
sandy.to_csv('example_pull.csv')
We coordinated to split up the job of pulling these loops. We looped through a total of 180000 tweets from the landfall of Sandy. We used Google Colab and Google Cloud Computing to run our pull loops over long stretches and collected data into a handful of csvs, which we combined to create our main data set for model building.
Combining All the Pulls
data1 = pd.read_csv('alexpulls.csv')
data2 = pd.read_csv('eamonpulls.csv')
data3 = pd.read_csv('javipulls.csv')

data = pd.concat([data1,data2,data3], ignore_index=True)
data.drop(columns=['Unnamed: 0'])
data.dropna(subset=['id','text','created_at'], inplace=True)
pd.to_csv('./csvs/sandy_landfall.csv')
Filtering for Disaster Tweets: Figure Eight Model
One of the first issues we ran into in approaching our newly collected dataset is scale. We knew we would have to manually label the critically relevant tweets, however it was unfeasible to search through over 100k tweets to do this. So how could we whittle the larger body of tweets down to a selection of at least disaster-related tweets that we could then go through manually.
We discovered a dataset on the website Figure Eight that had also been posted to Kaggle. It was essentially a dataset of tweets from the time and location of recent disaster scenarios which had been labeled for whether they referred to the actual disaster or not. So we figured that by training on this dataset first, we could develop a way to whittle our list down to at least disaster-related tweets.
#Cleaning Kaggle Data (remove http addresses with regex, lowercase the text)
df = pd.read_csv('./csvs/figure_eight_dataset.csv')
df['text'] = df['text'].apply(lambda x: re.split('http:\/\/.*', str(x))[0])
df['text'] = df['text'].apply(lambda x: re.split('https:\/\/.*', str(x))[0])
df = df[df.duplicated('text')==False]
df['text']= df['text'].map(lambda x: x.lower())
Train Test Split
X = df['text']
y = df['target']

X_train, X_test, y_train, y_test = train_test_split(X, y , stratify=y, random_state=24)
Logistic Regression GridSearch, Multiple Vectorizers
We ran Logistic Regression GridSearches with multiple vectorizers (Tdidf, Hashing, Count), and found that CountVectorizer performed the best.
pipe = Pipeline([
    ('vect', CountVectorizer()),
    ('model', LogisticRegression())
])

params = {
    'vect__min_df':[2, 4, 6],                            #In the paragraph after I will explain the parameters chosen
    'vect__ngram_range':[(1,2),(1,3)],
    'vect__stop_words':[None, 'english'],
    'model__penalty':['l1','l2'],
    'model__C':[0.01, 0.1 ,1]
}

gs = GridSearchCV(pipe, params, cv=5, verbose=2, n_jobs=-1)

gs.fit(X_train, y_train)

print('Best Params: ',gs.best_params_)
print('Best Estimator Score Train: ', gs.best_estimator_.score(X_train, y_train))
print('Best Estimator Score Test: ', gs.best_estimator_.score(X_test, y_test))
Random Forest GridSearch, Multiple Vectorizers
pipe = Pipeline([
    ('vect', CountVectorizer()),
    ('model', RandomForestClassifier() )
])

params = {
    'vect__min_df':[2,4,6],
    'vect__stop_words':[None ,'english'],
    'vect__ngram_range':[(1,2),(1,3)],
    'model__n_estimators':[75, 200, 500],
    'model__max_depth':[5, 25, 75],
    'model__min_samples_split':[2,3,4]
}

gs = GridSearchCV(pipe, params, cv=5, verbose=2, n_jobs=-1)

gs.fit(X_train, y_train)

print('Best Params: ',gs.best_params_)
print('Best Estimator Score Train: ', gs.best_estimator_.score(X_train, y_train))
print('Best Estimator Score Test: ', gs.best_estimator_.score(X_test, y_test))
SVM GridSearch, Multiple Vectorizers
pipe = Pipeline([
    ('vect', CountVectorizer()),
    ('model', svm.SVC())
])

params = {
    'vect__min_df':[2,4,6],
    'vect__stop_words':[None ,'english'],
    'model__kernel':['rbf','poly'],
    'model__C':[.1, 1, 10]
}

gs = GridSearchCV(pipe, params, cv=5, verbose=2, n_jobs=-1)

gs.fit(X_train, y_train)

print('Best Params: ',gs.best_params_)
print('Best Estimator Score Train: ', gs.best_estimator_.score(X_train, y_train))
print('Best Estimator Score Test: ', gs.best_estimator_.score(X_test, y_test))
Naive Bayes GridSearch, Multiple Vectorizers
pipe = Pipeline([
    ('vect', CountVectorizer()),
    ('model', MultinomialNB())
])

params = {
    'vect__min_df':[1,2,4, 6],
    'vect__stop_words':[None, 'english'],
    'model__alpha': [0.1,1,10]
}

gs = GridSearchCV(pipe, params, cv=5, verbose=2, n_jobs=-1)

gs.fit(X_train, y_train)

print('Best Params: ',gs.best_params_)
print('Best Estimator Score Train: ', gs.best_estimator_.score(X_train, y_train))
print('Best Estimator Score Test: ', gs.best_estimator_.score(X_test, y_test))
XGBoost GridSearch, Multiple Vectorizers
We ran a number of different boosting classifiers with multiple vectorizers, of which XG Boost performed the best.
pipe = Pipeline([
    ('vect', CountVectorizer()),
    ('model', XGBClassifier())
])

params = {
    'vect__min_df':[2,4,6],
    'vect__stop_words':[None,'english'],
    'model__n_estimators': [700, 1500],
    'model__min_samples_split':[2,4,6],
    'model__max_depth':[3,5]
}

gs = GridSearchCV(pipe, params, cv=5, verbose=2, n_jobs=-1)

gs.fit(X_train, y_train)

print('Best Params: ',gs.best_params_)
print('Best Estimator Score Train: ', gs.best_estimator_.score(X_train, y_train))
print('Best Estimator Score Test: ', gs.best_estimator_.score(X_test, y_test))
VotingClassifier with best LogReg, XGBoost, RandomForest (Final Model Choice)
Ultimately we went with a VotingClassifier that combined the predictive input of multiple models (LogReg, XGBoost, and Random Forest).
model = Pipeline([
        ('count_vect', CountVectorizer(min_df=2,
                                  ngram_range=(1, 3))),
        ('clf', VotingClassifier(estimators=[("pip1", LogisticRegression(penalty='l2', C=0.1)),
                                             ("pip2", XGBClassifier(n_estimators=1500, min_samples_split = 2, max_depth= 3)),
                                             #("pip3", svm.SVC(kernel='rbf',C=10,probability=True)),
                                             #("pip4", MultinomialNB(alpha=1)),

                                             ("pip5", RandomForestClassifier(max_depth=75,
                                                                             min_samples_split=4,
                                                                             n_estimators=200))],voting='soft'))
         ])
model.fit(X_train, y_train)
Our cross-val score for this model was 0.802, against a baseline accuracy of about 0.58. This is the best result we saw in this modeling process.
Training the VotingClassifier on the Figure Eight Dataset
vectorizer = CountVectorizer(min_df=2, ngram_range = (1,3))

X_train_features = vectorizer.fit_transform(X_train)
X_test_features = vectorizer.transform(X_test)


model = VotingClassifier(estimators=[("pip1", LogisticRegression(penalty='l2', C=0.1)),
                                  ("pip2", XGBClassifier(n_estimators=1500, min_samples_split = 2, max_depth= 3)),
                                  ("pip3", RandomForestClassifier(max_depth=75, min_samples_split=4, n_estimators=200))]
                                    ,voting='soft')
model.fit(X_train_features, y_train)

#
print('Best Estimator Score Train: ', model.score(X_train_features, y_train))
print('Best Estimator Score Test: ', model.score(X_test_features, y_test))
Confusion Matrix
predictions = model.predict(X_test_features)

def make_nice_conmat(y_test, preds):

    cmat = confusion_matrix(y_test, preds)
    print(f'Accuracy: {accuracy_score(y_test, preds)}')
    print(classification_report(y_test, preds))
    return pd.DataFrame(cmat, columns=['Predicted ' + str(i) for i in ['Regular Tweets','Disaster Tweets']],\
            index=['Actual ' + str(i) for i in ['Regular Tweets','Disaster Tweets']])

make_nice_conmat(y_test, predictions)

Train VotingClassifier on Entire Figure 8 Dataset
vectorizer2 = CountVectorizer(min_df=2, ngram_range = (1,3))

X_features = vectorizer2.fit_transform(X)


model2 = VotingClassifier(estimators=[("pip1", LogisticRegression(penalty='l2', C=0.1)),
                                  ("pip2", XGBClassifier(n_estimators=1500, min_samples_split = 2, max_depth= 3)),
                                  ("pip3", RandomForestClassifier(max_depth=75, min_samples_split=4, n_estimators=200))]
                                    ,voting='soft')
model2.fit(X_features, y)
model2.score(X_features,y)
predictions2 = model2.predict(X_features)
df['predictions'] = predictions2
Filtering for Disaster Tweets: Crisis Words
We were less than completely satisfied with the output of the Kaggle model, and in particular, looking closely at the dataset, felt that some of the labeling was suspect or flat out incorrect. We had to time-box ourselves to a degree in this project, but we decided that a keyword list could be useful in further filtering for tweets of disaster relevance. We felt it was better to cast a wider net, as we would be loathe to miss a truly critical tweet.
We were able to locate a long, standardized list of disaster-related keywords on the CrisisNLP website. We imported this and added some words of our own. In particular, the CrisisNLP list appeared to be designed for circumstances in which the words are pre-tokenized. Seeing as we could filter based on the complete tweet texts, we condensed the list somewhat to avoid redundancy.
#This is where we added words of our own to the single word items in the existing CrisisNLP list.
#This is the list we will use to filter.  An enterprising user of our model could edit this list themselves very easily:
keys_slist = [
 '911',
 'affected',
 'aftermath',
 'ambulance',
 'arrest',
 'attack',
 'authorities',
 'blast',
 'blood',
 'body',
 'bodies',
 'bomber',
 'bombing',
 'braces',
 'buried',
 'burn',
 'casualties',
 'cleanup',
 'collapse',
 'collapsed',
 'conditions',
 'crash',
 'crisis',
 'damage',
 'danger',
 'dead',
 'deadly',
 'death',
 'destroyed',
 'destruction',
 'devastating',
 'disaster',
 'displaced',
 'donate',
 'dozens',
 'dramatic',
 'drown',
 'emergency',
 'enforcement',
 'evacu',
 'events',
 'explosion',
 'fallen',
 'fatalities',
 'fire',
 'flood',
 'flooding',
 'floodwaters',
 'footage',
 'gun',
 'help!',
 'hurricane',
 'imminent',
 'impacted',
 'injured',
 'injuries',
 'inundated',
 'investigation',
 'killed',
 'landfall',
 'levy',
 'looting',
 'magnitude',
 'massive',
 'military',
 'missing',
 'nursing',
 'outage',
 'paramedic',
 'prayers',
 'praying',
 'ravaged',
 'recede',
 'recover',
 'redcross',
 'relief',
 'rescue',
 'rescuers',
 'residents',
 'responders',
 'rubble',
 'saddened',
 'safety',
 'scream',
 'seismic',
 'seizure',
 'shelter',
 'shooter',
 'shooting',
 'shot',
 'soldier',
 'storm',
 'stream',
 'surviving',
 'survivor',
 'terrifying',
 'terror',
 'toll',
 'tornado',
 'torrential',
 'toxins',
 'tragedy',
 'tragic',
 'troops',
 'twister',
 'unaccounted',
 'urgent',
 'victims',
 'volunteers',
 'warning',
 'wounded']
Apply Filters to Generate List of Disaster Tweets
Apply Figure 8 Model to Sandy Landfall Tweets
data = pd.read_csv('./csvs/sandy_landfall.csv')

#Cleaning
data.dropna(subset=['id','text','created_at'], inplace=True)
data['text'] = data['text'].str.replace('[^\w\s#@/:%.,_-]', '', flags=re.UNICODE)
data['text'] = data['text'].map(lambda x: x.lower())
data['text'] = data['text'].apply(lambda x: re.split('http:\/\/.*', str(x))[0])
data['text'] = data['text'].apply(lambda x: re.split('https:\/\/.*', str(x))[0])
data = data[data.duplicated('text')==False]

#Apply VotingClassifier model to data
with open('kaggle_model_2.pkl', 'rb') as file:
    model = pickle.load(file)
data['predicted']= model.predict(data['text'])
Apply Keyword Filter to Sandy Landfall Tweets
#Isolates tweets that have not been predicted as disaster tweets by the Figure 8 model
non_predicted = data[data['predicted']==0]
predicted = data[data['predicted']==1]

#Recall that keys_slist is the list of crisis keywords defined explicitly above
#This maps through the tweets not labeled as disaster and labels them as disaster if they include keywords
non_predicted['predicted'] = non_predicted['text'].map(lambda x: 1 if sum([x.find(i) + 1 for i in keys_slist])>0 else 0)

#Combines keyword flags and Figure 8 model flags to produce the set of all disaster tweets
keywords =non_predicted[non_predicted['predicted']==1]
disaster_tweets = pd.concat([keywords,predicted], ignore_index=True)

#Produces set of all regular tweets
regular_tweets = non_predicted[non_predicted['predicted']==0]
disaster_tweets.to_csv('./csvs/disaster_tweets.csv')
regular_tweets.to_csv('./csvs/regular_tweets.csv')
Identifying Critical Tweets Among Disaster Tweets
Manually Labeling Disaster Related Tweets
We combed through the approximately 9000 tweets identified by the Figure Eight Model and Keyword Filtering as disaster tweets. We manually identified about 900 tweets that we felt met criteria for "critical" - i.e.; novel information that could be immediately relevant to emergency responders.
#Reload disaster tweets with labels now included
disaster_labeled = pd.read_csv('./csvs/manual_tags_final.csv')
disaster_labeled.head()
The tag column indicates whether the tweet was manually tagged as "critical". This is based on our first tagging run, in which we cast a relatively wide net. The predicted column indicates whether the tweet is disaster related (all of these were, of course), in case we want to concatenate with our regular tweets data (predicted = 0) later on.
The above is also a good look at what our tweet data dictionaries contain. Not everything is immediately relevant to the project here, but we left in anything that might be used predictively later on. Obviously, we have the specific ID that we can use to look up the tweet online, or use as an index. We also have:
- the text of the tweet
- the timestamp
- the geo-coordinate information
- a place dictionary that contains information about the area including the city/neighborhood of origin
- a dictionary of information about the user sending the tweet
- a dictionary that grabs any hashtags the tweet contains
- a column that allows us to tell if the tweet was a reply or not
- the language of the tweet
Labeled Disaster Tweets - Data Cleaning
#Check if we missed or deleted any cells while tagging manually
disaster_labeled[disaster_labeled['tag'].isnull()==True]
disaster_labeled['tag'] = disaster_labeled['tag'].fillna(0)
disaster_labeled['tag'].value_counts()
disaster_labeled.dropna(subset=['id','text','created_at'],inplace=True)

#english language only
disaster_labeled = disaster_labeled[disaster_labeled['lang']=='en']
#create readable datetime column and sort by datetime
disaster_labeled['datetime'] = pd.to_datetime(disaster_labeled['created_at'])
disaster_labeled = disaster_labeled.sort_values('datetime').reset_index(drop=True)

#Selects columns of interest
disaster_labeled = disaster_labeled[['id','text','datetime','geo','predicted','tag']]

#remove retweets (begins with rt)
disaster_labeled['text'] = disaster_labeled['text'].map(lambda x: np.nan if x.find('rt')==0 else x)
disaster_labeled.dropna(subset=['text'],inplace=True)

#remove retweets (contains rt elsewhere)
disaster_labeled['text'] = disaster_labeled['text'].map(lambda x: np.nan if 'rt' in x.split(' ') else x)
disaster_labeled.dropna(subset=['text'],inplace=True)
disaster_labeled.head()
disaster_labeled.to_csv('./csvs/disaster_labeled.csv',index=False)

disaster_labeled[disaster_labeled['tag']==1].to_csv('./csvs/critical.csv', index=False)
disaster_labeled[disaster_labeled['tag']==0].to_csv('./csvs/disaster_nonrel.csv', index=False)
Weighting and Bootstrapping
After manually tagging, we had about a 9:1 ratio of disaster non critical to disaster critical tweets, so baseline accuracy of about 90%. In order to resolve this it was necessary to oversample the tweets we had labeled critical (bootstrapping). We expanded the 900ish critical tweets to 9000, balancing the classes evenly.
While manually tagging, we had often felt that some of the tweets we labeled critical were borderline, while others were immediate and dire, and highly useful potentially. We felt this should be reflected in our bootstrapping by using weighted probabilities in our oversampling. We thus went through the 900 critical tweets and weighted them 1, 3, 5, or 10 based on their degree of relevance to emergency personnel who might be scanning twitter for information. We then normalized these to percentages of 1 to create probabilities for use in bootstrapping.
weighted = pd.read_csv('./csvs/weighted_critical.csv')

#Converts manually assigned weights to bootstrap weighted probabilities
weighted['weight']= weighted['weight'].map(lambda x: x/weighted['weight'].sum())

boot = weighted.sample(9000,replace=True, weights=weighted['weight'])
boot.drop(columns = ['weight'],inplace=True)

nonrel = pd.read_csv('./csvs/disaster_nonrel.csv')
nonrel.drop(columns='Unnamed: 0', inplace=True)

disaster = pd.concat([nonrel, boot], ignore_index=True)
#So now we have a training set composed of roughly equal classes - half are irrelevant disaster-related tweets,
#and the other half are critical tweets that have been bootstrapped with weights to appear multiple times.
Training Model to Predict Actual Relevance from within Disaster Related Tweets
We tried our hand with a few different things, but ended up settling on a similarly trained VotingClassifier to our earlier Figure 8 Model, with combination of trained LogReg, XGBoost and Random Forest Classifiers.
X = disaster['text']
y = disaster['tag']

critical_from_disaster_model = Pipeline([
        ('count_vect', CountVectorizer(min_df=2,
                                  ngram_range=(1, 3))),
        ('clf', VotingClassifier(estimators=[("pip1", LogisticRegression(penalty='l2', C=0.1)),
                                  ("pip2", XGBClassifier(n_estimators=1500, min_samples_split = 2, max_depth= 3)),
                                  ("pip3", RandomForestClassifier(max_depth=75, min_samples_split=4, n_estimators=200))]
                                    ,voting='soft'))
         ])
critical_from_disaster_model.fit(X, y)
We observed cross-validation scores in the mid to high 90s with this training process, however this was obviously the result of highly weighted bootstrapped replacement tweets appearing in the test split as well as in the train split. The only way to really assess performance is to run the model on test data and see how its predictions perform.
WordCloud: Words that Help Identify Critical Tweets Among Disaster Tweets

Obviously the words here are somewhat specific to the Sandy Hurricane, which we would expect. Continuing to train with a wider variety of disasters (wildfires, tornadoes, mass shootings, earthquakes, etc - even everyday emergencies perhaps) would allow the model to become more generalized.
Testing 2-Phase Model {1. Disaster Filter, 2. Predict Critical} on New Data
Building ID List for Sandy Test Set
For our test set, we wanted to sample from a wider section of the hurricane's course. We aimed for about 40000 tweets for the test set. We decided to randomly select 40000 tweets from the 2 million or so post-landfall time window tweets, so, starting at the end of the window of our training set (10PM on 10/29) through the last timestamp in the ID List (11/2).
#creates our test set id list
#Random selection of tweets over the rest of the hurricane, so we can show geographic progression in mapping as well
#40,500 was chosen as n because it is a convenient multiple of 2700 (900*3) for the tweet pulls

sandy_random = dftime.loc[4608435:6000000,:]
sandy_random = sandy_random.sample(40500,replace=False,random_state=37)
sandy_random = sandy_random.sort_values('datetime')
sandy_random = sandy_random.reset_index()
sandy_random.to_csv('./csvs/sandy_random.csv',index=False)
As with the main set, we ran tweet pulls in tandem and combined the resulting csvs to complete the test set.
Cleaning the Test Data
testset = pd.read_csv('./csvs/testset.csv')

testset.dropna(subset=['id','text','created_at'],inplace=True)

testset = testset[testset['lang']=='en']

#create readable datetime column and sort by datetime
testset['datetime'] = pd.to_datetime(testset['created_at'])
testset = testset.sort_values('datetime').reset_index(drop=True)

#english language only
testset = testset[testset['lang']=='en']

#create readable datetime column and sort by datetime
testset['datetime'] = pd.to_datetime(testset['created_at'])
testset = testset.sort_values('datetime').reset_index(drop=True)

#Selects columns of interest
testset = testset[['id','text','datetime','geo']]

#remove retweets (begins with rt)
testset['text'] = testset['text'].map(lambda x: np.nan if x.find('rt')==0 else x)
testset.dropna(subset=['text'],inplace=True)

#remove retweets (contains rt elsewhere)
testset['text'] = testset['text'].map(lambda x: np.nan if 'rt' in x.split(' ') else x)
testset.dropna(subset=['text'],inplace=True)

testset['id'] = testset['id'].map(lambda x: int(x))

testset['text'] = testset['text'].str.replace('[^\w\s#@/:%.,_-]', '', flags=re.UNICODE)
testset['text']= testset['text'].map(lambda x: x.lower())
testset['text'] = testset['text'].apply(lambda x: re.split('http:\/\/.*', str(x))[0])
testset['text'] = testset['text'].apply(lambda x: re.split('https:\/\/.*', str(x))[0])

testset.to_csv('./csvs/testset.csv',index=False)
Running the Filter/Models on the Test Data to Identify Critical Tweets
#Run Figure 8 model and separate into regular and disaster tweets.
testset['is_disaster']= kaggle_model.predict(testset['text'])
test_regular = testset[testset['is_disaster']==0]
test_disaster = testset[testset['is_disaster']==1]

#Apply keyword filter to tweets identified as regular by Figure 8
#to identify additional disaster tweets, and combine to collect all disaster tweets
test_regular['is_disaster'] = test_regular['text'].map(lambda x: 1 if sum([x.find(i) + 1 for i in keys_slist])>0 else 0)
contains_keywords = test_regular[test_regular['is_disaster']==1]
test_disaster = pd.concat([contains_keywords,test_disaster], ignore_index=True)

#Run Critical Tweet Identifier model on disaster tweets
test_disaster['is_critical']= critical_from_disaster_model.predict(test_disaster['text'])

#Save all regular tweets (not disaster related)
test_regular.to_csv('./csvs/test_regular.csv',index=False)

#Save all disaster-related tweets that are not relevant
test_disaster_nonrel = test_disaster[test_disaster['is_critical'] == 0]
test_disaster_nonrel.to_csv('./csvs/test_disaster_nonrel.csv',index=False)

#Save all tweets that were identified as disaster AND critical
test_critical = test_disaster[test_disaster['is_critical'] == 1]
test_critical.to_csv('./csvs/test_critical.csv',index=False)
Results on Test Data
Out of the 25000 or so tweets in the test set, our two-phase model identified about 50 as potentially critical tweets. You can review these below. Given the limitations we had to work with in terms of bootstrapping, and simply not having that much data for the problem, we were quite pleased with the performance here. Most of the tweets identified as critical do seem to correspond to situations where the hurricane is actively creating problems. You sense immediacy in most of these tweets.
Comparing this to a selection of the non-relevant disaster tweets, or the regular tweets (seen below), we can see that the model is actually doing a pretty excellent job of homing in on real issues and ignoring other mentions of the storm. This is a pretty remarkable result, and we have reason to expect that there is still a lot of potential for the model to improve, with an appropriately large and diverse data set.
Tweets That Were Identified as Critical
for i in test_critical['text']:
    print(i)
    print('----------')
Tweets That Were Identified as Disaster Related but Not Critical
for i in test_disaster_nonrel['text'].head(50):
    print(i)
    print('----------')
Tweets That Were Identified as Regular, Non-Disaster
for i in test_regular['text'].head(50):
    print(i)
    print('----------')
Create Combined Landfall Dataset with Class Labeling
We wanted to build out a cleaned, combined dataset of our Sandy landfall tweets to be able to use the geo-tags we have to build a map where we can easily represent how disaster and critical tweets can be visualized amid the sea of all tweets. For this we are returning to our main data set.
#This is the portion of Sandy Landfall Tweets (our main pull) that was not labeled
#as disaster tweets by either the Figure 8 Model or the Keyword Filtering - so regular tweets.
regular_tweets = pd.read_csv('./csvs/regular_final.csv')
regular_tweets.head()
Regular Tweets - Data Cleaning
#creates target column for regular tweets, all of which should be 0
regular_tweets['tag'] = np.zeros(len(regular_tweets))
regular_tweets.shape
regular_tweets.isnull().sum()
regular_tweets.dropna(subset=['text','created_at'],inplace=True)
#english language only
regular_tweets = regular_tweets[regular_tweets['lang']=='en']

#create readable datetime column and sort by datetime
regular_tweets['datetime'] = pd.to_datetime(regular_tweets['created_at'])
regular_tweets = regular_tweets.sort_values('datetime').reset_index(drop=True)

#Selects columns of interest
regular_tweets = regular_tweets[['id','text','datetime','geo','predicted','tag']]

#remove retweets (begins with rt)
regular_tweets['text'] = regular_tweets['text'].map(lambda x: np.nan if x.find('rt')==0 else x)
regular_tweets.dropna(subset=['text'],inplace=True)

#remove retweets (contains rt elsewhere)
regular_tweets['text'] = regular_tweets['text'].map(lambda x: np.nan if 'rt' in x.split(' ') else x)
regular_tweets.dropna(subset=['text'],inplace=True)

regular_tweets['id'] = regular_tweets['id'].map(lambda x: int(x))
Combine Regular and Disaster
disaster_labeled = pd.read_csv('./csvs/disaster_labeled.csv')
disaster_labeled.head()
#Combines disaster-related and regular tweets into a cleaned dataset containing all three classes
#(Regular, Disaster Non-Critical, and Disaster Critical)
#The convenience of this dataset is it can easily be manipulated to have a class column with all three types labeled.
#This will be useful for geo-mapping visualizations.
sandy_combined = pd.concat([disaster_labeled,regular_tweets],ignore_index=True)
sandy_combined['datetime'] = pd.to_datetime(sandy_combined['datetime'])
sandy_combined = sandy_combined.sort_values('datetime')
sandy_combined['id'] = sandy_combined['id'].map(lambda x: int(x))
sandy_combined.to_csv('./csvs/sandy_combined.csv')
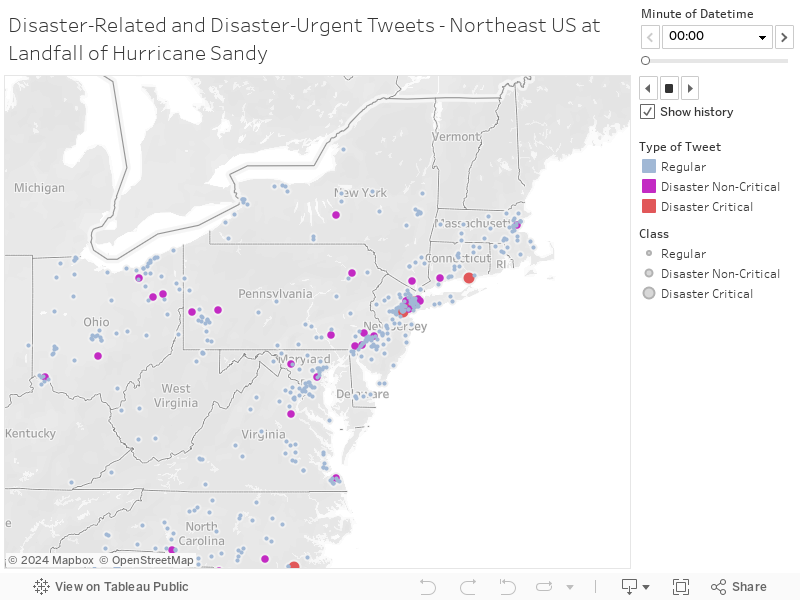
Geomapping Landfall Data in Tableau
For the first geomap, we want to map the full body of tweets (regular, disaster, and critical) from the main pull, ie all geotagged tweets from the northeastern seaboard from the time of Sandy landfall in NJ/NY to about 15 hours later. Some additional processing needs to be done. Also, not all tweets in our pull have precise coordinates, although most do.
Geomap Preprocessing
sandy_geomap = pd.read_csv('./csvs/sandy_combined.csv')
#Remove all rows that don't have coordinates
sandy_geomap = sandy_geomap[sandy_geomap['geo'].notnull()==True]

#Splits geo column into latitude and longitude columns
sandy_geomap['geo'] = sandy_geomap['geo'].map(lambda x: x.split('[')[1].split(']')[0])
sandy_geomap['latitude'] = sandy_geomap['geo'].map(lambda x: x.split(',')[0])
sandy_geomap['longitude'] = sandy_geomap['geo'].map(lambda x: x.split(',')[1])
sandy_geomap['latitude'] = sandy_geomap['latitude'].map(lambda x: float(x))
sandy_geomap['longitude'] = sandy_geomap['longitude'].map(lambda x: float(x))

#Condenses to relevant information for geomapping
sandy_geomap = sandy_geomap[['id','text','latitude','longitude','datetime','predicted','tag']]
sandy_geomap.info()
sandy_geomap['class'] = sandy_geomap['predicted'] + sandy_geomap['tag']
sandy_geomap['class'].value_counts()
sandy_geomap.to_csv('./csvs/sandy_geomap.csv',index=False)
len(sandy_geomap)
sandy_geomap.head()
Mapping Disaster-Related and Critical Tweets - Hurricane Sandy Landfall - Northeast Region (Tableau)
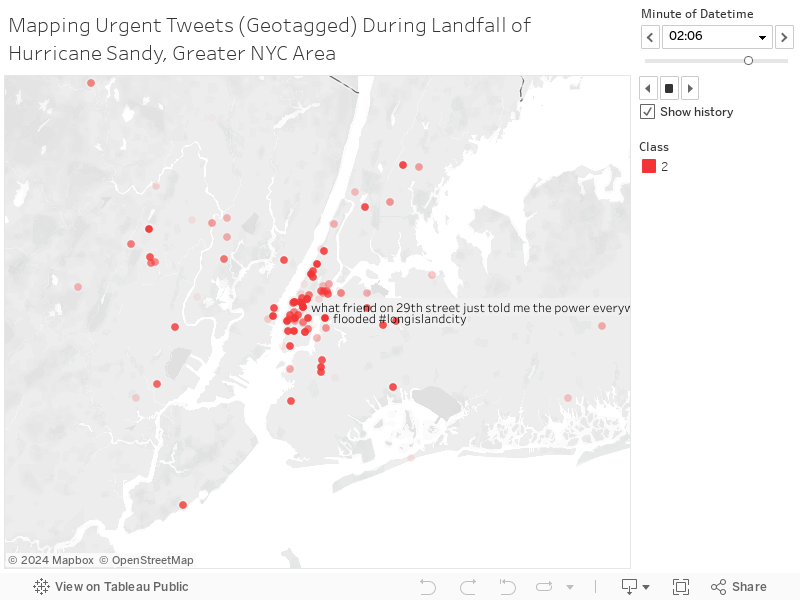
Real-Time Mapping Disaster Critical Tweets in the NYC Area during Hurricane Sandy Landfall (Tableau)
Live Streaming Disaster Tweets via Twython
We wanted to return at the end to the root purpose of the project and see what we could do with applying our model to real-time tweets. The primary difficulty here was just obtaining the tweets, but we were able to develop a method using Twython.
#This set of code uses Twython to stream tweets with disaster keywords in real-time.
#It also compiles these incoming tweets into dataframes of n=100, for potential analysis with our model.

from twython import TwythonStreamer
import pandas as pd
import datetime
import pickle
class MyStreamer(TwythonStreamer):
    def on_success(self, data, ids=[], texts=[],geos=[],created_ats=[],df = pd.DataFrame(columns=['id','text','geo','created_at']),count=0 ):
        print(data['text'])
        now = datetime.datetime.now()
        ids.append(data['id'])
        texts.append(data['text'])
        geos.append(data['geo'])
        created_ats.append(data['created_at'])
        count = len(texts)
        print(count)
        if count == 10:
            df['id'] = ids
            df['text'] = texts
            df['geo'] = geos
            df['created_at'] = created_ats
            df.to_csv("./Live_tweets/Live Tweets "+ str(now)+".csv")
            print('CSV SAVED')
            count = 0
            df = pd.DataFrame(columns=['id','text','geo','created_at'])

stream = MyStreamer(app_key='INSERT KEY HERE',
                    app_secret='INSERT KEY HERE',
                    oauth_token='INSERT KEY HERE',
                    oauth_token_secret='INSERT KEY HERE')


stream.statuses.filter(track= ['fire'])
Conclusions
Our primary takeaways in this project thus far are as follows:
Despite initial setbacks, we were able to arrive at a satisfying and effective two-phase process for identifying critical disaster tweets out of the sea of all incoming tweets on social media. We were pleased with how well we were able to isolate potentially relevant tweets from a sea of test data. We also successfully visualized what an interface for receiving geotagged tweets in real-time might look like, although we expect a more integrated and multi-functional mapping software than Tableau might be necessary for real-world implementation. Finally, we were able to demonstrate proof-of-concept on live-streaming capture of tweets.
Given unrestricted access to the data available via Twitter, let alone Facebook, Snapchat, Instagram (all of which FEMA or a similar organization would likely have in the hypothetical scenario where they would implement this process), I feel we have demonstrated that it would be absolutely possible to build out a very useful and accurate geo-feed of emergency response information in the area of an ongoing disaster.
An ideal implementation perhaps would be to continually label critical tweets after the fact and progressively train for different types of emergency tweets over many documents and events. Emergency personnel whose job it is to review the incoming tweets that the existing model has identified as critical could also be tasked with manually labeling the identified tweets as truly critical or not as they come in, with this labeling feeding back into actively improving the performance of the model as time goes on. With enough development, we could reach a point where we have specialized models for different disaster types, which emergency personnel could turn on as appropriate once a disaster scenario is live.
All of this bodes well for future expansion of the project. Other directions we might go with more time include attempting to involve another social media platform, or locate a database of tweets from a disaster scenario other than a hurricane to try and diversify our filtering process. We also would like to try and improve predictive accuracy by use of Words2Vec, which is well equipped to locate similar types of tweets (e.g. critical tweets) without explicit labeling.